Mastering Day 20: What, Why & How
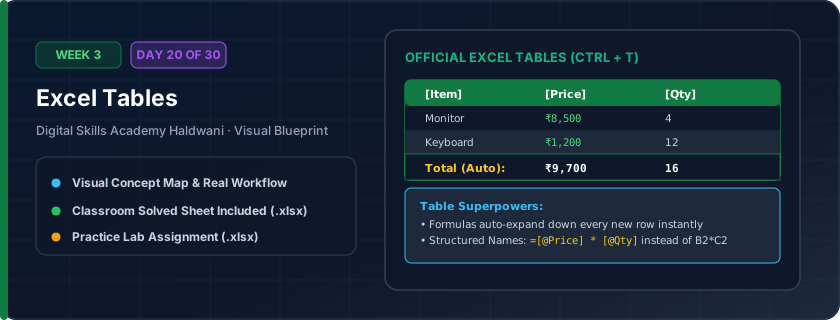
Converting a plain, static cell range into an official, intelligent Excel Table with alternating banded rows, automatic formula expansion, and built-in filter headers by pressing Ctrl + T.
In ordinary ranges, adding a row at the bottom requires re-formatting and dragging down formulas manually. In an Excel Table, new rows inherit all formulas, formatting, and validations automatically.
"Ctrl + T transforms plain grids into smart tables! As you add rows, the table grows and carries all formulas automatically."
What You Will Master Today
- Differences between a standard cell range and an official Excel Table object
- Automatic banded row formatting and permanent filter arrows
- Auto-expanding table boundary: typing in the next row automatically absorbs formulas and formatting
- Structured references: writing readable formulas like '=[@Price]*[@Qty]'
- Total Row feature for 1-click summary aggregations (Sum, Average, Count)
Step-by-Step Practical Walkthrough
Select any cell inside your dataset and press Ctrl + T.
Ensure 'My table has headers' is checked and click OK.
Go to Table Design tab and check the 'Total Row' checkbox.
Click on any cell in the Total Row to pick from a dropdown of formulas (Sum, Average, Count).
Haldwani Fitness Club - Active Gym Membership Table with Total Row
Study the completed reference worksheet below. Every column illustrates the standard formatting, formula structure, and alignment applied by professional office operators.
| Member ID | Member Name | Plan Type | Monthly Fee (₹) | Trainer Add-on (₹) | Total Monthly (₹) |
|---|---|---|---|---|---|
| GYM-01 | Kunal Rawat | Annual Gold | ₹1,500.00 | 1000 | 2500 |
| GYM-02 | Priyanka Joshi | Monthly Silver | ₹2,000.00 | 0 | 2000 |
| GYM-03 | Mohit Bisht | Quarterly Diamond | ₹1,800.00 | 1500 | 3300 |
| GYM-04 | Simran Negi | Annual Gold | ₹1,500.00 | 1000 | 2500 |
| GYM-05 | Rajat Pandey | Monthly Silver | ₹2,000.00 | 1000 | 3000 |
Restaurant Daily Order Billing Log Table
- Task 1: Convert the data range into an official Excel Table using Ctrl + T.
- Task 2: In Column F, type formula '=[@[Food Total (₹)]]+[@[Beverages (₹)]]+[@[Service Charge (₹)]]' and observe how the entire column auto-calculates instantly!
- Task 3: Go to Table Design tab and enable 'Total Row'.
- Task 4: Press Tab on the last data cell and add a new row: watch the table automatically expand formulas.
Exercise Data Template Preview: Download the .xlsx file below and execute each task independently.
| Bill No | Table No | Food Total (₹) | Beverages (₹) | Service Charge (₹) | Grand Total (₹) |
|---|---|---|---|---|---|
| BILL-101 | Table 4 | 1450 | 420 | 100 | |
| BILL-102 | Table 2 | 850 | 180 | 50 | |
| BILL-103 | Table 8 | 2600 | 850 | 180 | |
| BILL-104 | Table 1 | 620 | 120 | 40 | |
| BILL-105 | Table 6 | 1950 | 550 | 120 |
Excel Tables automatically update charts and Pivot Tables! When new rows are added, your reports adjust automatically without re-selecting ranges.
Need 1-on-1 Guidance on Day 20?
Join our hands-on classroom lab sessions at Digital Skills Academy in Haldwani. Every student receives a dedicated PC workstation, live instructor reviews, and interview prep.